Aton announces the first results and completion of the resource infill RC drilling programme at Hamama West
Vancouver, British Columbia, August 26, 2022: Aton Resources Inc. (AAN: TSX-V) (“Aton” or the “Company”) is pleased to update investors on progress at its Hamama West gold-silver project, located in the Company’s 100% owned Abu Marawat Concession (“Abu Marawat” or the “Concession”), in the Eastern Desert of Egypt.
Highlights:
- The Hamama West RC infill drilling programme was completed on August 24, 2022, with a total of 6,620m drilled, including 5 holes at the West Garida prospect;
- Assay results have been received for the first 35 holes, HAP-101 to HAP-135, to date;
- Significant intersections include 2.90 g/t Au, 68.9 g/t Ag and 3.71 g/t AuEq over a 37m interval from surface (drill hole HAP-115), 2.87 g/t Au, 54.3 g/t Ag and 3.51 AuEq over a 22m interval from 1m depth (hole HAP-110), and 1.43 g/t Au, 24.1 g/t Ag and 1.72 g/t AuEq over a 32m interval from 3m depth (hole HAP-115).
“The RC resource infill drilling programme at Hamama West has now been completed on schedule, and we are surely pleased with the initial results of the drilling that we have received so far” said Tonno Vahk, Interim CEO. “The results are in line with our expectations, and again confirm that the Hamama West oxide gold cap will be an easily mineable body of oxide mineralisation outcropping at surface, and which metallurgical testing has shown to be eminently treatable using heap leach processing technology. As soon as all the results have been received they will be forwarded on to our consultants Cube Consulting, who will commence work on revising the Hamama West mineral resource estimate. The development of the Hamama West starter open pit and heap leach project on the outcropping oxides, as only the second commercial gold mining operation in Egypt, will be a huge step forwards for the mining and mineral exploration sector in Egypt, the Egyptian Mineral Resources Authority, and of course for Aton, and for all our stakeholders.”
Hamama West RC drilling programme
The Hamama West project has an indicated resource of 137,000 ounces of gold equivalent (“AuEq”, gold and silver combined), and an inferred resource of 341,000 ounces AuEq. The uppermost oxide and transitional component of the Hamama West deposit (the “gold oxide cap”) comprises an inferred resource of 106,000 ounces AuEq (see news release dated January 24, 2017). Metallurgical testwork has indicated average gold recoveries of 75.6% and 72.7% from oxide and transitional mineralisation types respectively (see news release dated February 22, 2018), using standard heap leach processing technology. Aton plans to initially mine the outcropping oxide gold cap of the deposit, which is mineralised directly from surface, as a low capex/opex starter open pit mining operation, with a heap leach processing facility. The Hamama West oxides will provide early cash flow, and will represent the first stage of phased mine development at the Abu Marawat Concession.
The reverse circulation percussion (“RC”) resource infill drilling programme at the Hamama West gold-silver project (Figure 1) has now been completed, with the final hole, HAP-204, terminated on August 24, 2022. The programme was designed by Aton, in conjunction with our mineral resource consultants, Cube Consulting (Perth, Western Australia), to primarily test the oxide and transitional portion of the Hamama West mineral resource estimate (“MRE”), with the specific objective of upgrading the confidence of the existing inferred resource. A number of holes also tested the underlying sulphide resource, and a series of deeper holes was added at the end of the programme with a view to testing potential deeper sulphide mineralisation, and increasing the overall MRE at Hamama West.
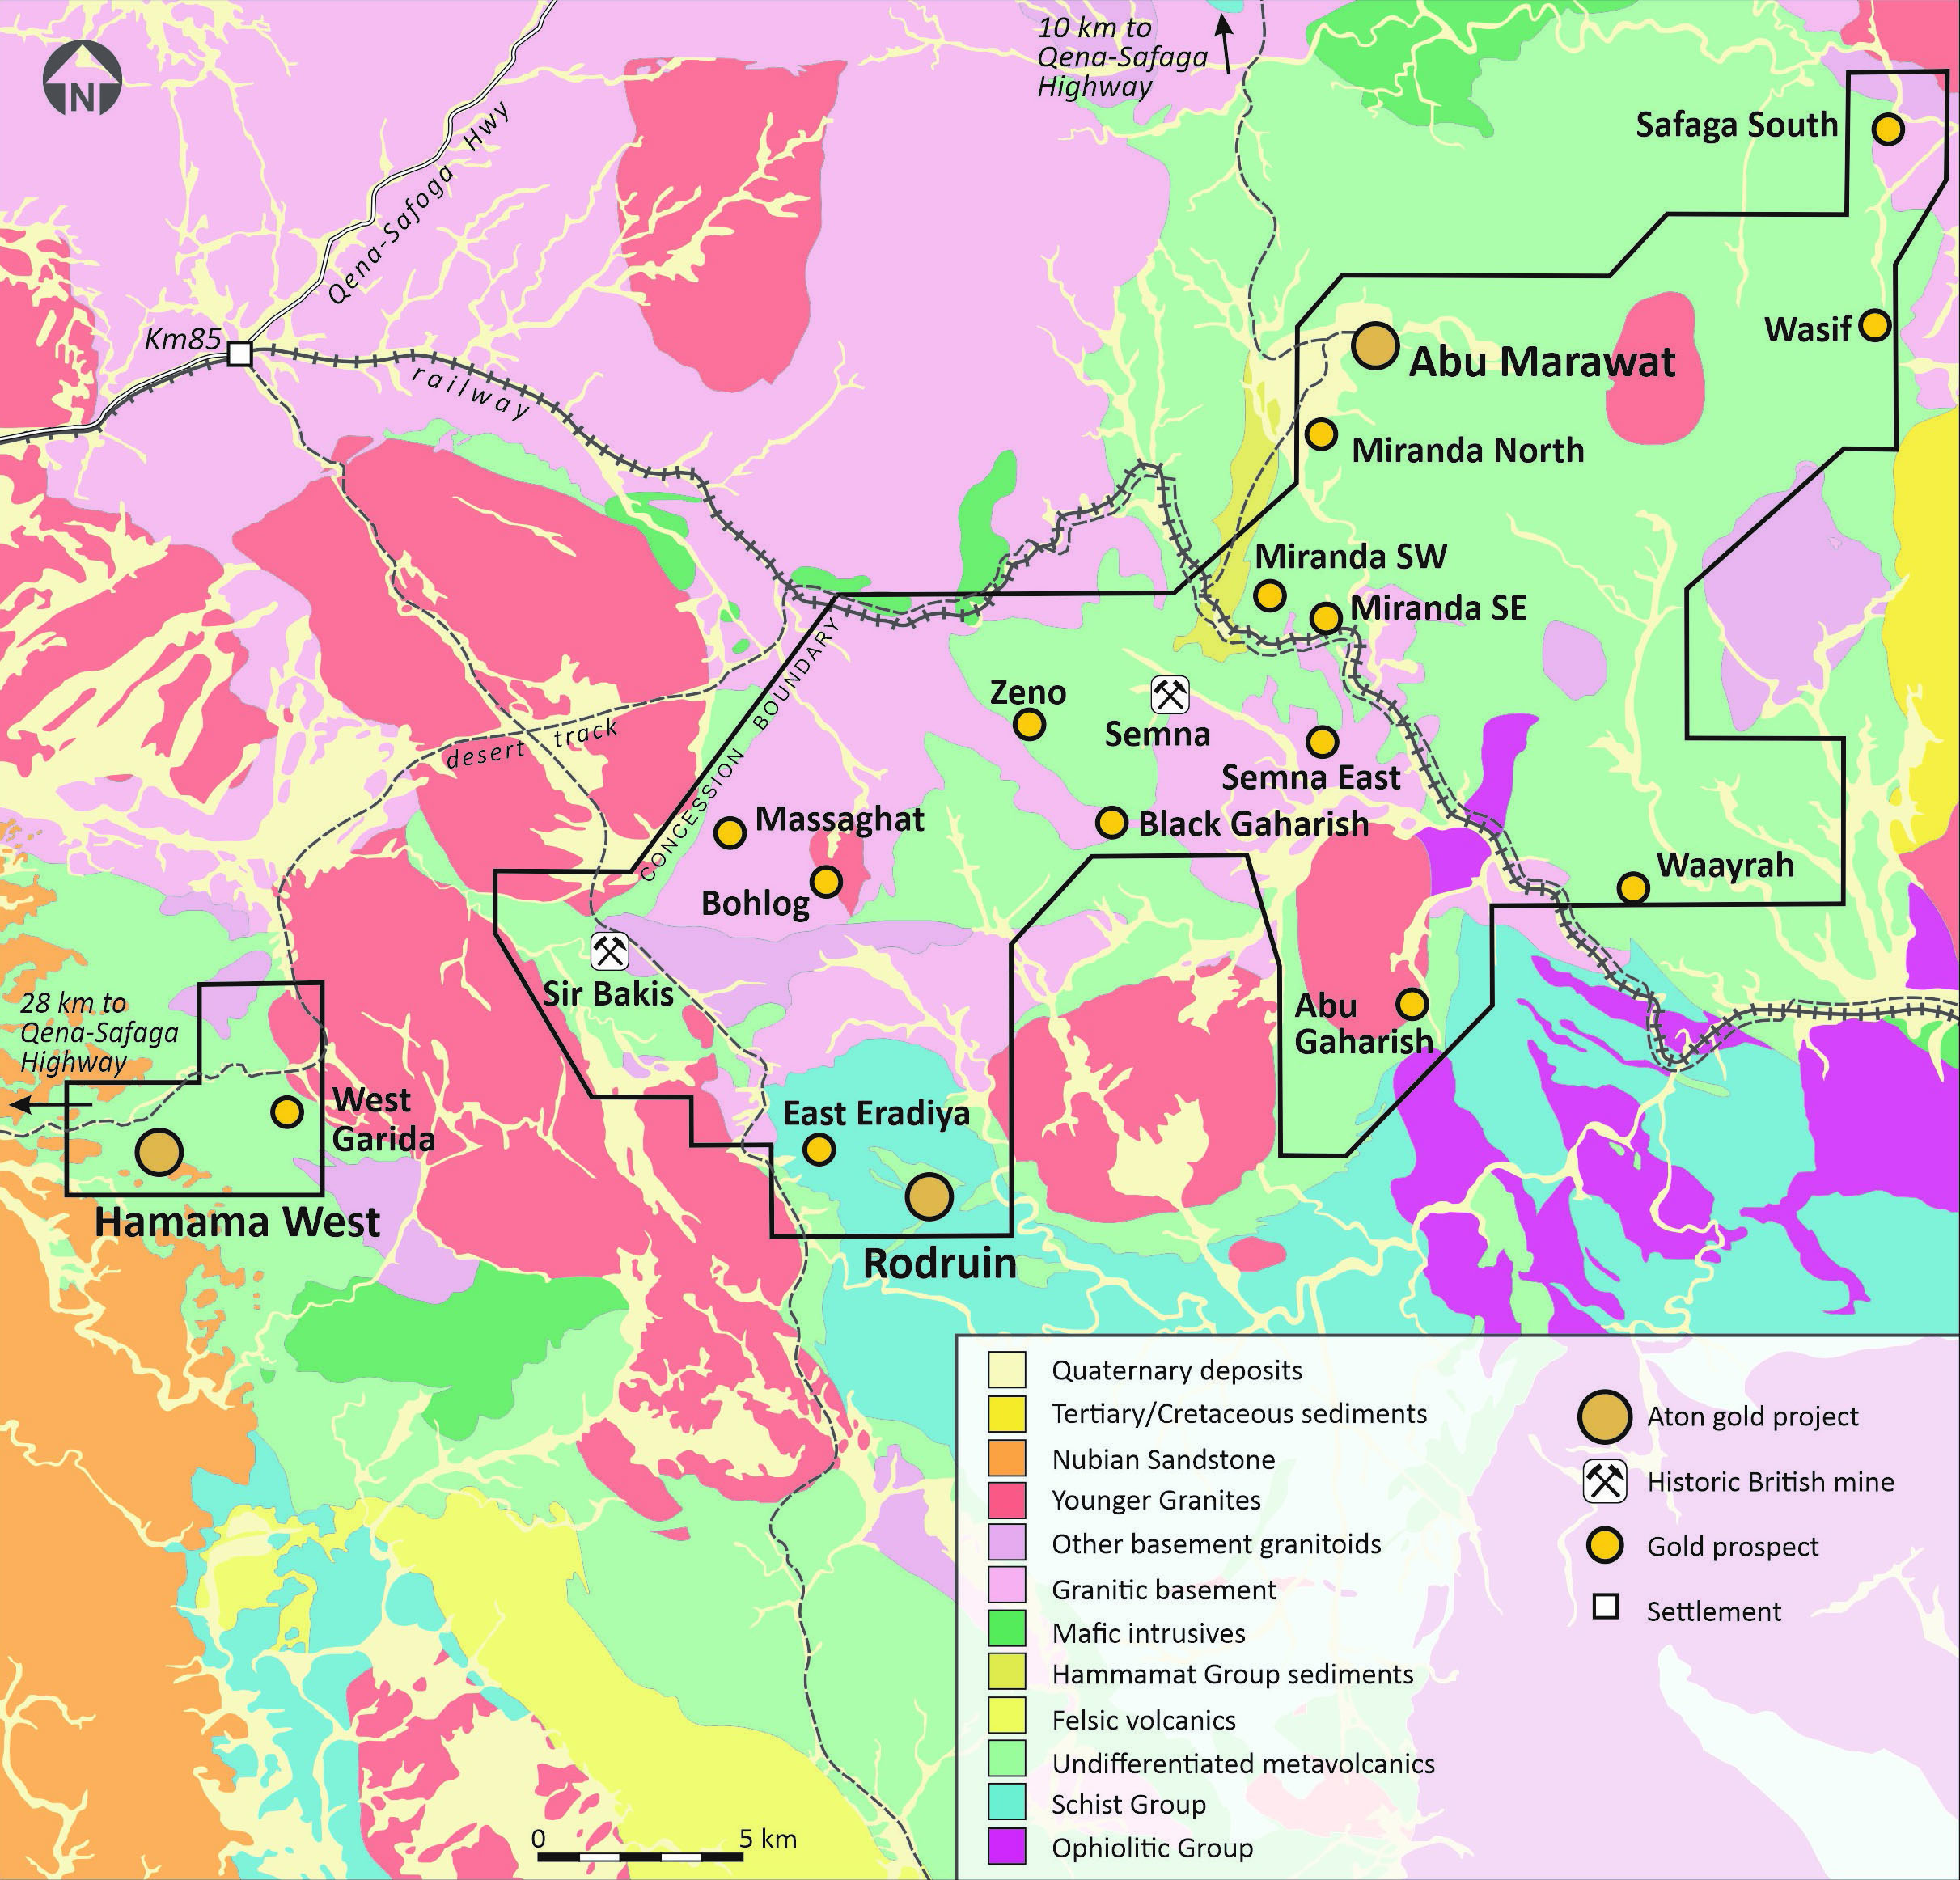
Figure 1: Geology plan of the Abu Marawat Concession, showing the location of the Hamama West project

Figure 2: Schematic geology of the Hamama – West Garida areaA total of 6,620m was drilled for the programme, predominantly at the Hamama West zone. 3 holes were completed, for 297m, at the Western Carbonate zone, and 5 holes, for 390m, at the West Garida prospect approximately 3km east of Hamama West (Figure 2), with the remaining 5,933m drilled at Hamama West.
Drill holes were laid out using handheld GPS, with all collars to be surveyed by total station within the coming week. Drill holes were down hole surveyed at appropriate intervals using a Champ GyroTM north-seeking gyroscopic survey tool. Collar details of holes HAP-101 to HAP-135 are provided in Table 1 below:
Hole ID | Collar co-ordinates 1 | Dip 2 | Grid azimuth 2 | EOH depth (m) | Comments | ||
X | Y | Z | |||||
HAP-101 | 534289 | 2913870 | 506 | -60 | 187 | 120 | |
HAP-102 | 534316 | 2913876 | 516 | -50 | 180 | 100 | |
HAP-103 | 534339 | 2913865 | 510 | -55 | 180 | 110 | |
HAP-104 | 534358 | 2913840 | 507 | -55 | 180 | 100 | |
HAP-105 | 534344 | 2913832 | 507 | -55 | 180 | 75 | |
HAP-106 | 534319 | 2913832 | 507 | -55 | 180 | 70 | |
HAP-107 | 534280 | 2913818 | 527 | -75 | 180 | 95 | |
HAP-108 | 534280 | 2913818 | 527 | -55 | 180 | 80 | |
HAP-109 | 534281 | 2913784 | 528 | -50 | 180 | 58 | |
HAP-110 | 534286 | 2913766 | 528 | -65 | 180 | 25 | |
HAP-111 | 534321 | 2913750 | 520 | -90 | n/a | 25 | |
HAP-111a | 534317 | 2913752 | 520 | -90 | n/a | 4 | Re-drill of top 4m of HAP-111 |
HAP-112 | 534341 | 2913749 | 522 | -55 | 180 | 25 | |
HAP-113 | 534342 | 2913722 | 524 | -55 | 180 | 20 | |
HAP-114 | 534340 | 2913765 | 531 | -55 | 180 | 35 | |
HAP-115 | 534338 | 2913785 | 528 | -55 | 180 | 45 | |
HAP-116 | 534400 | 2913757 | 535 | -90 | n/a | 20 | |
HAP-117 | 534400 | 2913772 | 522 | -90 | n/a | 40 | |
HAP-118 | 534429 | 2913771 | 534 | -90 | n/a | 20 | |
HAP-118a | 534426 | 2913771 | 534 | -90 | n/a | 4 | Re-drill of top 4m of HAP-118 |
HAP-119 | 534458 | 2913787 | 530 | -90 | n/a | 35 | |
HAP-120 | 534459 | 2913805 | 527 | -55 | 180 | 40 | |
HAP-121 | 534490 | 2913807 | 530 | -90 | 0 | 50 | |
HAP-122 | 534490 | 2913807 | 530 | -55 | 180 | 40 | |
HAP-123 | 534524 | 2913792 | 535 | -55 | 180 | 25 | |
HAP-124 | 534496 | 2913771 | 535 | -90 | n/a | 30 | |
HAP-125 | 534530 | 2913771 | 532 | -90 | n/a | 20 | |
HAP-126 | 534563 | 2913783 | 530 | -55 | 180 | 40 | |
HAP-127 | 534563 | 2913783 | 530 | -90 | n/a | 50 | |
HAP-128 | 534601 | 2913789 | 534 | -55 | 180 | 40 | |
HAP-129 | 534601 | 2913789 | 534 | -90 | n/a | 50 | |
HAP-130 | 534335 | 2913809 | 518 | -55 | 180 | 60 | |
HAP-131 | 534361 | 2913806 | 516 | -55 | 180 | 70 | |
HAP-132 | 534405 | 2913820 | 518 | -55 | 188 | 70 | |
HAP-133 | 534430 | 2913821 | 521 | -55 | 180 | 60 | |
HAP-134 | 534461 | 2913829 | 518 | -55 | 180 | 50 | |
HAP-135 | 534488 | 2913840 | 517 | -50 | 180 | 60 | |
Notes:
| |||||||
Table 1: Collar details of RC percussion holes HAP-101 to HAP-135
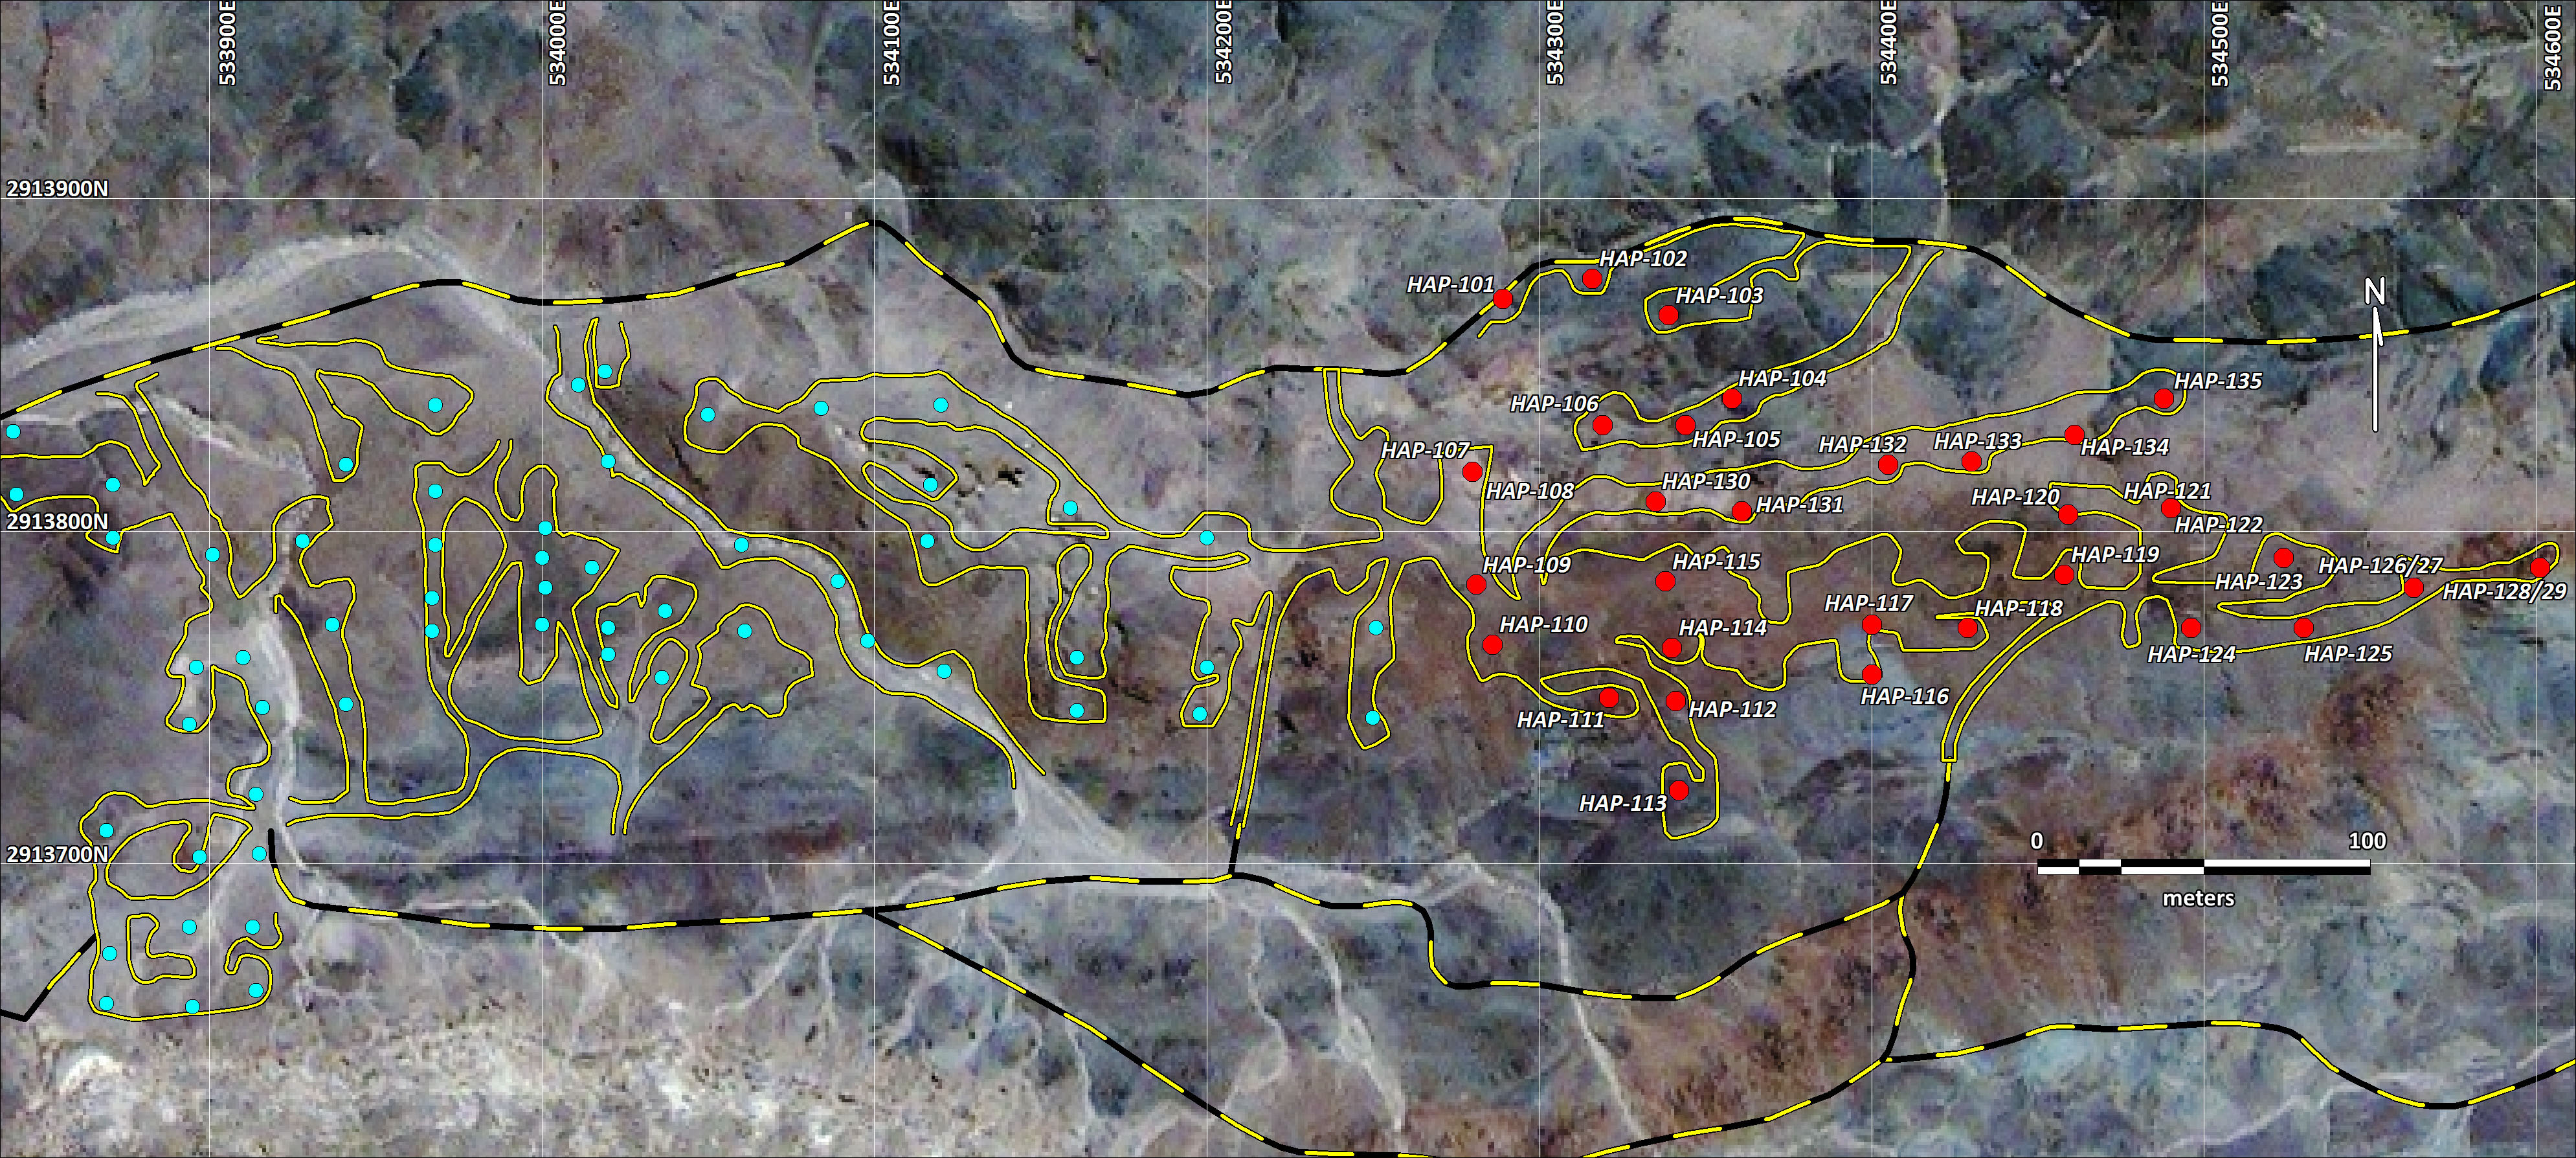
Figure 3: Hamama West RC drilling programme – drill hole collar plan (red: holes reporting, blue: oxide/transitional holes completed, but yet to be reported)Results
Selected significant intersections from the first 35 holes are shown below in Table 2, and full results from all holes are provided in Appendix A.
Hole ID | Intersection (m) 1 | Au (g/t) | Ag (g/t) | AuEq 2 (g/t) | Comments | ||
From | To | Interval | |||||
HAP-101 | 68 | 96 | 28 | 0.76 | 53.33 | 1.39 | Sulphide mineralisation |
HAP-107 | 40 | 56 | 16 | 1.22 | 54.46 | 1.86 | Oxide / sulphide mineralisation |
HAP-108 | 35 | 52 | 17 | 0.94 | 30.77 | 1.30 | Oxide / sulphide mineralisation |
HAP-109 | 3 | 35 | 32 | 1.43 | 24.09 | 1.72 | Oxide mineralisation from surface |
HAP-110 | 1 | 23 | 22 | 2.87 | 54.27 | 3.51 | Oxide mineralisation from surface |
HAP-111 | 0 | 10 | 10 | 1.80 | 132.1 | 3.36 | Oxide mineralisation from surface |
HAP-112 | 0 | 5 | 5 | 5.55 | 156.6 | 7.40 | Oxide mineralisation from surface |
HAP-114 | 0 | 20 | 20 | 1.90 | 42.40 | 2.40 | Oxide mineralisation from surface |
HAP-115 | 0 | 37 | 37 | 2.90 | 68.94 | 3.71 | Oxide mineralisation from surface |
HAP-116 | 0 | 7 | 7 | 3.07 | 37.07 | 3.51 | Oxide mineralisation from surface |
HAP-117 | 0 | 11 | 11 | 2.35 | 40.39 | 2.82 | Oxide mineralisation from surface |
HAP-118 | 0 | 10 | 10 | 1.25 | 29.35 | 1.59 | Oxide mineralisation from surface |
HAP-119 | 0 | 16 | 16 | 1.86 | 27.57 | 2.18 | Oxide mineralisation from surface |
HAP-120 | 1 | 31 | 30 | 1.06 | 21.93 | 1.32 | Oxide mineralisation from surface |
HAP-130 | 0 | 35 | 35 | 0.99 | 29.41 | 1.34 | Oxide mineralisation from surface |
HAP-131 | 17 | 34 | 17 | 1.26 | 98.35 | 2.42 | Transitional mineralisation |
and | 41 | 51 | 10 | 0.95 | 17.41 | 1.15 | Sulphide mineralisation |
Notes:
| |||||||
Table 2: Selected mineralised intersections from RC percussion holes HAP-101 to HAP-135
Sampling and analytical procedures
The RC holes were drilled at 140mm diameter, and the bulk percussion chip samples were collected directly into pre-written large plastic bags from the cyclone every metre, numbered with the hole number and hole depths, and laid out sequentially at the drill site. Between each metre of drilling the cyclone and top box were cleaned out with compressed air. The bags were then moved to a logging and storage area where the chips were logged by Aton geologists. The bulk 1m samples were weighed, and subsequently riffle split through a 3-tier splitter onsite by Aton field staff to produce an approximately 1/8 split, which was collected in cloth bags, numbered and tagged with the hole number and depth. The splitter was cleaned with compressed air between each sample. The reject material from this initial bulk split was re-bagged, labelled and tagged, and the bulk reject samples will be stored and retained on site at Hamama. A representative sample of each metre was washed, stored in marked plastic chip trays, each containing 20m of samples, photographed, and retained onsite as a permanent record of the drill hole.
All the 1m split samples were weighed again, and the samples were riffle split onsite at the Hamama sample preparation facility, typically a further 3-4 times using a smaller lab splitter, to produce a nominal c. 250-500g sample split for dispatch to the assay laboratory. Again the splitter was cleaned with compressed air between each sample. The laboratory splits were allocated new sample numbers.
QAQC samples are inserted into the sample stream at a rate of approximately 1 certified reference material (or “standard” sample) every 30 samples, 1 blank sample every 15 samples, and 1 field duplicate split sample every 15 samples.
The c. 250-500g split samples were shipped to ALS Minerals sample preparation laboratory at Marsa Alam, Egypt, where they were pulverised to a size fraction of better than 85% passing 75 microns. From this pulverised material a further sub-sample was split off with a nominal c. 50g size, which was shipped on to ALS Minerals at Rosia Montana, Romania for analysis.
Samples were analysed for gold by fire assay with an atomic absorption spectroscopy (“AAS”) finish (analytical code Au-AA23), and for silver using an aqua regia digest followed by an AAS finish (analytical code Ag-AA45). Any high grade gold samples (Au >10 g/t) were re-analysed using analytical code Au-GRA21 (also fire assay, with a gravimetric finish). High grade Ag samples (Ag >100 g/t) were re-analysed using the ore grade technique Ag-AA46 (also an aqua regia digest followed by an AAS finish).
About Aton Resources Inc.
Aton Resources Inc. (AAN: TSX-V) is focused on its 100% owned Abu Marawat Concession (“Abu Marawat”), located in Egypt’s Arabian-Nubian Shield, approximately 200 km north of Centamin’s world-class Sukari gold mine. Aton has identified numerous gold and base metal exploration targets at Abu Marawat, including the Hamama deposit in the west, the Abu Marawat deposit in the northeast, and the advanced Rodruin exploration prospect in the south of the Concession. Two historic British gold mines are also located on the Concession at Sir Bakis and Semna. Aton has identified several distinct geological trends within Abu Marawat, which display potential for the development of a variety of styles of precious and base metal mineralisation. Abu Marawat is 447.7 km2 in size and is located in an area of excellent infrastructure; a four-lane highway, a 220kV power line, and a water pipeline are in close proximity, as are the international airports at Hurghada and Luxor.
Qualified person
The technical information contained in this News Release was prepared by Javier Orduña BSc (hons), MSc, MCSM, DIC, MAIG, SEG(M), Exploration Manager of Aton Resources Inc. Mr. Orduña is a qualified person (QP) under National Instrument 43-101 Standards of Disclosure for Mineral Projects.
For further information regarding Aton Resources Inc., please visit us at www.atonresources.com or contact:
TONNO VAHK
Interim CEO
Tel: +1 604 318 0390
Email: info@atonresources.com
Note Regarding Forward-Looking Statements
Some of the statements contained in this release are forward-looking statements. Since forward-looking statements address future events and conditions; by their very nature they involve inherent risks and uncertainties. Actual results in each case could differ materially from those currently anticipated in such statements.
Neither TSX Venture Exchange nor its Regulation Services Provider (as that term is defined in policies of the TSX Venture Exchange) accepts responsibility for the adequacy or accuracy of this release.
Appendix A
Hole ID | Intersection (m) 1 | Au (g/t) | Ag (g/t) | AuEq2 | Comments | ||
From | To | Interval | |||||
HAP-101 | 68 | 96 | 28 | 0.76 | 53.33 | 1.39 | |
HAP-102 | - | - | - | - | - | - | NSA, 2m @ 0.18 g/t Au (on hangingwall contact) |
HAP-103 | 87 | 91 | 4 | 0.55 | 7.38 | 0.63 | |
HAP-104 | - | - | - | - | - | - | NSA, 1m @ 0.23 g/t Au (on hangingwall contact) |
HAP-105 | 38 | 40 | 2 | 1.21 | 38.80 | 1.66 | |
and | 59 | 61 | 2 | 0.67 | 12.30 | 0.82 | |
HAP-106 | 52 | 56 | 4 | 0.83 | 12.40 | 0.97 | |
HAP-107 | 40 | 56 | 16 | 1.22 | 54.46 | 1.86 | |
HAP-108 | 35 | 52 | 17 | 0.94 | 30.77 | 1.30 | |
HAP-109 | 3 | 35 | 32 | 1.43 | 24.09 | 1.72 | |
HAP-110 | 1 | 23 | 22 | 2.87 | 54.27 | 3.51 | |
HAP-111 | 0 | 10 | 10 | 1.80 | 132.1 | 3.36 | |
HAP-112 | 0 | 5 | 5 | 5.55 | 156.6 | 7.40 | |
HAP-113 | - | - | - | - | - | - | Collared in hangingwall, not mineralised |
HAP-114 | 0 | 20 | 20 | 1.90 | 42.40 | 2.40 | |
HAP-115 | 0 | 37 | 37 | 2.90 | 68.94 | 3.71 | |
HAP-116 | 0 | 7 | 7 | 3.07 | 37.07 | 3.51 | |
HAP-117 | 0 | 11 | 11 | 2.35 | 40.39 | 2.82 | |
HAP-118 | 0 | 10 | 10 | 1.25 | 29.35 | 1.59 | |
HAP-119 | 0 | 16 | 16 | 1.86 | 27.57 | 2.18 | |
HAP-120 | 1 | 31 | 30 | 1.06 | 21.93 | 1.32 | |
HAP-121 | - | - | - | - | - | - | No mineralisation |
HAP-122 | 16 | 27 | 11 | 1.12 | 24.02 | 1.40 | |
HAP-123 | 0 | 19 | 19 | 0.57 | 17.06 | 0.77 | |
HAP-124 | 0 | 4 | 4 | 1.33 | 93.70 | 2.43 | |
HAP-125 | 1 | 7 | 6 | 1.27 | 85.50 | 2.28 | 0-1m: NSR |
HAP-126 | - | - | - | - | - | - | No mineralisation - rhyolite dyke |
HAP-127 | 0 | 3 | 3 | 0.99 | 15.80 | 1.17 | Rhyolite dyke from 3m |
HAP-128 | 13 | 16 | 3 | 0.61 | 3.77 | 0.65 | 0-13m: rhyolite dyke |
HAP-129 | - | - | - | - | - | - | Rhyolite dyke from surface, 0-1m: 1.19 g/t Au |
HAP-130 | 0 | 35 | 35 | 0.99 | 29.41 | 1.34 | |
HAP-131 | 17 | 34 | 17 | 1.26 | 98.35 | 2.42 | |
and | 41 | 51 | 10 | 0.95 | 17.41 | 1.15 | |
HAP-132 | - | - | - | - | - | - | NSA > 0.79 g/t Au |
HAP-133 | - | - | - | - | - | - | NSA > 0.69 g/t Au (possibly did not intersect hangingwall?) |
HAP-134 | - | - | - | - | - | - | NSA (possibly did not intersect hangingwall?) |
HAP-135 | - | - | - | - | - | - | NSA (possibly did not intersect hangingwall?) |
Notes:
| |||||||