For Hamama West; Provides A Blueprint For Continued Resource Growth At Hamama
Vancouver, January 24, 2017: Aton Resources Inc. (AAN: TSX-V) (“Aton” or the “Company”) is pleased to announce a resource estimate for Hamama West, one of three contiguous zones that comprise the Hamama Project (“Hamama” or the “Project”), located within the Company’s 100% owned Abu Marawat Concession (“Abu Marawat”) in Egypt. Hamama West hosts an Inferred Mineral Resource of 341,000 ounces gold equivalent (“AuEq”) (see Table 1) and an Indicated Mineral Resource of 137,000 ounces AuEq (see Table 2).
Highlights:
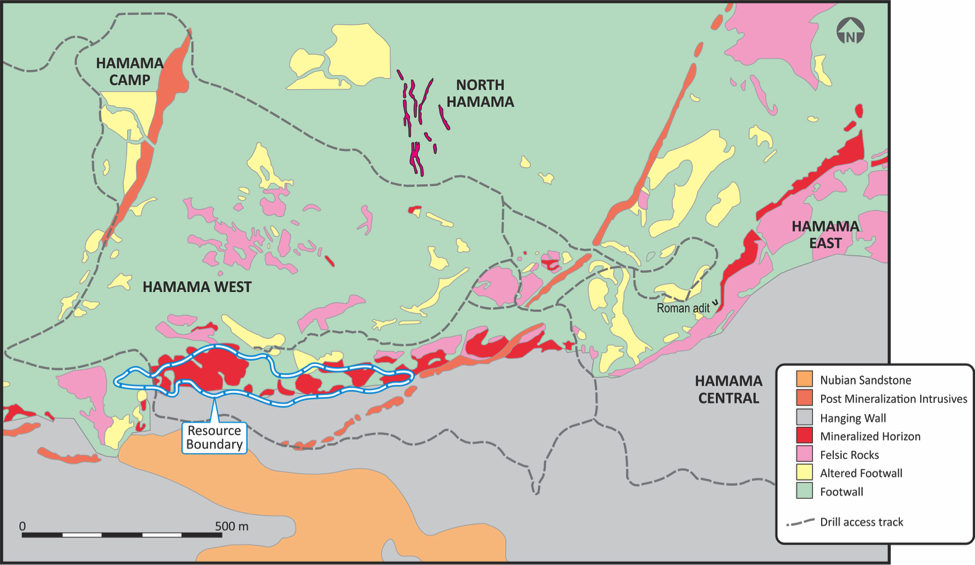
- Excellent potential to grow resources along strike and at depth: Hamama West resource represents only 750 metres of the 3,000-metre-long mineralized horizon at Hamama and the entire area remains open at depth (see Figure 1).
- Attractive open pit characteristics: Broad zones of gold mineralization starting at surface with oxide and transitional Inferred resources grading 1.28 g/t AuEq (see Table 1). In addition, Hamama is close to major infrastructure and is located in a low-cost operating environment.
- Opportunity to improve grade, increase resources and upgrade the resource category in the oxide cap: Aton believes that it will be able to increase the grade and the resources in the oxide cap with a short reverse circulation (“RC”) drill program. Further, the Company believes that it will be able to upgrade the oxide and transitional resource from the Inferred to Indicated category.
- Continued resource growth at Abu Marawat: Focus of the Company’s exploration program in 2017 will be expanding resources at both Hamama and the Abu Marawat gold deposit.
“I’m very pleased with the maiden resource estimate for Hamama West,” said Mark Campbell, President and CEO of Aton. “We set out to demonstrate Hamama’s overall potential with this resource estimate and I believe that we have done that. In addition to providing us with a blueprint for continued resource growth at Hamama, the resource estimate materially expands upon our existing resource base. As a Company, we are fortunate to have two gold deposits, Hamama and the Abu Marawat gold deposit, that have such great potential for resource growth along strike and at depth. Furthermore, we have more than a dozen exploration targets along the 40-km-long gold trend between the Hamama and Abu Marawat gold deposits.”
Rick Cavaney, Vice President of Exploration of Aton, noted that “In the near term, Aton will commence a multi-pronged exploration program that will look to accomplish several goals. We will look to increase the grade and resources from Hamama West’s oxide cap with a short reverse circulation program and will to seek to identify potential massive sulphide targets at Hamama with a geophysics program, which will include ground magnetics and ground and downhole electromagnetics. The Company will then focus on expanding resources at both Hamama and the Abu Marawat gold deposit. 2017 marks an exciting new phase for the Company, one of resource growth with an eye towards a Preliminary Economic Assessment and converting our exploration permit to an exploitation permit in 2018.”
Table 1: Inferred Mineral Resources at Hamama West
| Weathering type | Tonnes | Au (g/t) | Ag (g/t) | AuEq (g/t) | Au (koz) | Ag (koz) | AuEq (koz) |
| Oxide & Transitional | 2,580,000 | 0.87 | 28.1 | 1.28 | 72 | 2,334 | 106 |
| Sulphide | 5,630,000 | 0.87 | 30.4 | 1.30 | 157 | 5,503 | 235 |
| Total | 8,210,000 | 0.87 | 29.7 | 1.29 | 230 | 7,836 | 341 |
Table 2: Indicated Mineral Resources at Hamama West
| Weathering type | Tonnes | Au (g/t) | Ag (g/t) | AuEq (g/t) | Au (koz) | Ag (koz) | AuEq (koz) |
| Sulphide | 3,805,000 | 0.72 | 27.6 | 1.12 | 88 | 3,376 | 137 |
- Mineral resources are not mineral reserves and do not demonstrate economic viability.
- All tonnage, grade and ounces have been rounded and minor discrepancies in additive totals may occur.
- Weathering classification is based on visual assessment of drill core by geologists and does not represent a definitive geo-metallurgical classification.
- The mineral resource are quoted at a minimum cut-off grade of 0.5 g/t Au equivalent, where the silver contribution has been based on a silver:gold ratio of 70:1.
- Reasonable prospects of eventual economic extraction have been determined using assumptions based upon some African open pit projects of similar scale, and have included a gold price of US$1250/oz, generic open pit mining and processing costs and generic metallurgical recoveries for gold and silver. At this stage of the property’s development, no detailed economic, mining or metallurgical studies have been completed. The classification does not infer that mineral resources demonstrate economic viability.
Figure 1: Hamama West Resource Boundary
The independent mineral resource estimate for Hamama West was completed in accordance with National Instrument (“NI”) 43-101 and was undertaken by Cube Consulting Pty Ltd (Perth). Notes regarding the interpretation and estimation methodology can be found in the Appendix at the end of the news release. The Company will prepare and file a Technical Report under NI 43-101 within 45 days of the date of this news release.
Upcoming milestones:
- 240km2 WorldView-3 multispectral survey over the Hamama and Abu Marawat gold deposit areas;
- Ground magnetic, ground EM and downhole EM geophysical surveys at Hamama, with the primary goal of identifying potential massive sulphide targets;
- RC drilling with the aim of increasing the grade and resources from Hamama West’s oxide cap, and upgrading the oxide and transitional resource from the Inferred to Indicated category;
- Geophysical survey over an 8-km long hydrothermally altered and mineralized zone between the Abu Marawat gold deposit and Miranda;
- Drill testing potential targets generated by the geophysical survey at Hamama, the Abu Marawat gold deposit and Miranda (see Figure 2 for Abu Marawat Concession map);
- Metallurgical test work;
- Resource expansion at both Hamama and the Abu Marawat gold deposit.
Figure 2: Abu Marawat Concession map
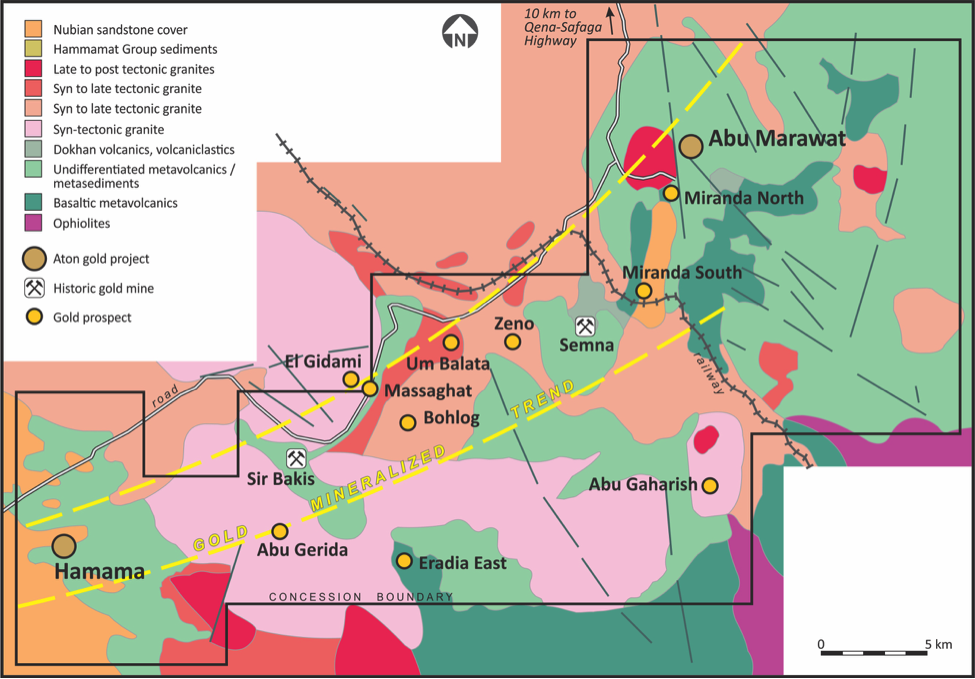
Table 3: Mineral Resources at Abu Marawat
| INFERRED MINERAL RESOURCES | |||||||||||
| Deposit | Class | Tonnes | Grade | Contained Metal | |||||||
| Au (g/t) | Ag (g/t) | Cu (%) | Zn (%) | Au (koz) | Ag (koz) | AuEq (koz) | Cu (m lbs) | Zn (m lbs) | |||
| Abu Marawat | Inferred
(open pit & u/g) | 2,879,000 | 1.75 | 29.3 | 0.77 | 1.15 | 162 | 2,713 | – | 49 | 73 |
| Hamama West | Inferred (oxide & transitional) | 2,580,000 | 0.87 | 28.1 | – | – | 72 | 2,334 | 106 | – | – |
| Inferred
(sulphide) | 5,630,000 | 0.87 | 30.4 | – | – | 157 | 5,503 | 235 | – | – | |
| TOTAL | Inferred | 11,089,000 | 1.10 | 29.6 | – | – | 391 | 10,550 | 341 | 49 | 73 |
| INDICATED MINERAL RESOURCES | |||||||||||
| Deposit | Class | Tonnes | Grade | Contained Metal | |||||||
| Au (g/t) | Ag (g/t) | Zn (%) | Au (koz) | Ag (koz) | AuEq (koz) | Cu (m lbs) | Zn (m lbs) | ||||
| Hamama West | Indicated (sulphide) | 3,805,000 | 0.72 | 27.6 | – | – | 88 | 3,376 | 137 | – | – |
| TOTAL | Indicated | 3,805,000 | 0.72 | 27.6 | – | – | 88 | 3,376 | 137 | – | – |
- Hamama West mineral resource estimate is estimated using a 0.5 g/t AuEq cut-off grade
- Hamama AuEq is based on an Au price of US$1250/oz (average Au price since May 2013), and a Au/Ag price ratio of 70:1 (indicating an Ag price of US$17.86/oz)
- Abu Marawat mineral resource estimate is based upon NSR cut-offs of US$20 per tonne and US$50 per tonne for open-pit and underground, respectively.
- No AuEq value is presented for Abu Marawat as it was not included in the Abu Marawat NI 43-101 technical report. See the independent technical report titled “Technical Report on the Abu Marawat Concession, Egypt” dated April, 2012 by Wayne W. Valliant, P.Geo., and Bernard Salmon, ing. of Roscoe Postle Associates Inc., available under the Company’s profile on SEDAR at sedar.com
About the Hamama project
The Hamama project (“Hamama”) is located at the western end of the 40-km long gold trend at the Abu Marawat concession and is comprised of three zones, Hamama West, Hamama Central and Hamama East. The mineralized horizon at Hamama has a strike length of approximately 3-km and remains open to the west and the east. Mapping indicates that the horizon may extend another 1.8-kms to the east. Further exploration work will be conducted to confirm this. Other potentially mineralized horizons, separate from the main mineralized horizon, have also been mapped in the general Hamama area.
About Aton Resources Inc.
Aton Resources Inc. (AAN: TSX-V) is focused on its 100% owned Abu Marawat concession, located in Egypt’s Arabian-Nubian Shield, approximately 200-km north of Centamin’s Sukari gold mine. Aton has identified a 40-km long gold trend at Abu Marawat, anchored by the Hamama project in the west and the Abu Marawat gold deposit in the east. In addition to the Hamama project and the Abu Marawat gold deposit, the trend contains numerous gold exploration targets, including two historic gold mines. Abu Marawat is over 738km2 in size and is located in an area of excellent infrastructure, a four-lane highway, a 220kV power line and a water pipeline are in close proximity.
Qualified Persons’ statement
Scientific or technical information in this news release that relates to the preparation of the Company’s mineral resource estimate is based on information compiled or approved by Matt Bampton, BSc (Hons. Geology), MSc (Env. Science), who is an employee of Cube Consulting Pty Ltd. and is considered to be independent of Aton Resources Inc. Mr. Bampton is a Member in good standing of the Australian Institute of Geosciences and has sufficient experience which is relevant to the commodity, style of mineralization under consideration and activity which he is undertaking to qualify as a Qualified Person under National Instrument 43-101. Mr. Bampton consents to the inclusion in this news release of the information, in the form and context in which it appears.
Qualified Person
The technical information contained in this News Release was prepared by Roderick Cavaney BSc, MSc
(hons), MSc (Mining & Exploration Geology), FAusIMM, SEG, GSA, SME, Vice President, Exploration, of Aton Resources Inc. Mr. Cavaney is a qualified person (QP) under National Instrument 43-101 Standards of Disclosure for Mineral Projects.
For further information regarding Aton Resources Inc., please visit us at www.atonresources.com or contact:
Mark Campbell
President and Chief Executive Officer
Tel: +1-936-689-2589
Email: mcampbell@atonresources.com
Blaine Monaghan
Vice President, Investor Relations
Tel: +1 (604) 331-5092
Email: ir@atonresources.com
Note Regarding Forward-Looking Statements
Some of the statements contained in this release are forward-looking statements. Since forward- looking statements address future events and conditions; by their very nature they involve inherent risks and uncertainties. Actual results in each case could differ materially from those currently anticipated in such statements.
Neither TSX Venture Exchange nor its Regulation Services Provider (as that term is defined in policies of the TSX Venture Exchange) accepts responsibility for the adequacy or accuracy of this release.
Appendix
The following notes outline the interpretation and estimation methodology for the Hamama West Mineral Resource estimate:
- The mineral resource estimate was undertaken by Cube Consulting Pty Ltd., a minerals industry consultancy based in Perth, Western Australia, which is independent of Aton Resources.
- The validated mineral resource drilling database contained the following drill hole data that was used directly in the mineral resource estimate: 74 mostly HQ-gauge diamond drill holes (6,597m).
- The mineral resource estimate used only diamond drilling data, but interpretation of geological boundaries with respect to surface outcrops were also informed by information from a number of trenches throughout the deposit.
- The drilling was completed in several phases by Aton Resources between December 2011 and August 2016.
- Drilling was generally oriented on north-south lines, with a range of drill-line spacings varying from approximately 30m to 50m depending on surface access and the intent of the drill programs.
- Collars for drill holes used in the mineral resource estimate have been surveyed by local survey contractors, Arab Nubia Group, using a Leica Viva GS10 DGPS unit.
- Downhole surveys have been conducted on the large majority of all diamond holes using a Reflex EZ-Trac multifunctional magnetic downhole survey tool. Surveying was undertaken by the drilling contractors.
- Geological logging of drill holes includes state of weathering, lithology, alteration, mineralogy, structural defects and geotechnical parameters. All drill hole logging data was compiled into a master drilling database.
- Diamond holes were logged and sampled over varying intervals according to geological observations, but generally were 1m length away from geological contacts. Samples submitted for assay were half-core.
- Diamond drilling from the older drilling campaigns had variable and often poor core recoveries near surface within the oxide mineralization domain. Approximately 20% of mineralized samples had core recoveries of less than 60%. These holes and these intervals were assessed collectively to determine the suitability for inclusion in the mineral resource estimation, and the confidence associated with this is reflected in the resource classification.
- Diamond core sawing and sample crushing (to nominally <4mm) was undertaken at Hamama’s on-site sample preparation facility. Samples were securely transported to Cairo, inspected at the Egyptian Geological Museum, and transport by commercial courier to an ALS Laboratory in Romania.
- Sampling and sample submission was conducted in accordance with a quality assurance/quality control program which includes the use of certified reference materials for diamond drill holes.
- At the ALS Laboratory, 500g sub-samples are pulverized to a standard of +85% passing 75µm. Gold content is determined by fire assay methods using a 30g charge, lead collection and an atomic absorption spectroscopy finish, with a lower detection limit of 0.01 ppm Au. Silver content is determined after an Aqua Regia digest, an atomic absorption spectroscopy finish, and with a lower detection limit of 0.2 ppm Ag.
- Structure, lithology, mineralization, weathering and surface topography surfaces were interpreted in 3D using GEOVIA SurpacTM
- Lithological, structural and alteration information from drill hole logging was primarily used to develop interpretations of the mineralized domains and gold assays were used as a secondary determinant.
- Mineralized interpretations were not done at a specific lower grade cut-off, and the grade estimation method (ordinary kriging, followed by localized uniform conditioning) was considered acceptable to estimate the grade distribution and reflect its variability.
- No additional dilution beyond the major geological domain boundaries was included in the estimation.
- The mineralization interpretation consists of 8 individual domains, defined by lithological, weathering and spatial characteristics. All the material that was considered for classification as a resource was from 2 domains, being the fresh component and the combined oxide and transitional component, of the main interpreted mineralized horizon.
- For the purposes of density measurement, a total of 1,612 samples were collected from drill holes within the deposit, covering all weathering types and representative lithologies. A density value was then assigned for each of the weathering types and representative lithologies in the mineral resource estimate.
- Two metre downhole composites were extracted from the assay database based on the mineralized wireframes and form the basis for statistical analysis, variography and grade interpolation.
- Gold and silver assays were reviewed on an individual domain basis to determine appropriate top-cuts for each domain to reduce the influence of grade outliers. A top-cut of 150g/t was applied for silver in the main mineralized domains, with the exception of a poorly-defined high grade zone in the central part of the deposit, where a top-cut of 400g/t was applied for silver in two drill holes. No top-cuts for gold were considered to be warranted. In general, the grade domains represent distinct geological and statistical populations and provide a robust basis for mineral resource estimation.
- Variography was completed to analyze the spatial continuity of the grade within the major mineralized domains using ISATIS® The two main domains were selected for analysis to characterize the grade continuity for grade interpolation. Resultant variogram models were used to determine the appropriate estimation parameters for grade interpolation into the block model.
- A Quantitative Kriging Neighbourhood Analysis (QKNA) was performed on both the fresh and oxide material to help inform decisions on the minimum and maximum number of composites used to estimate a block.
- For the main domains, Ordinary Kriging using ISATIS® software was used to undertake the grade estimation, with block estimates based on grade interpolation into parent cells with dimensions of 20m x 20m x 10m (XYZ). This was followed by localized uniform conditioning to provide a better estimate for what was considered to be a reasonably diffuse grade distribution within the mineralized domain, and where with the current drill density ordinary kriging may result in an over-smoothed estimate.
- For some minor mineralized domains (none of which has been classified as a resource), Ordinary Kriging using GEOVIA SurpacTM software was used for the grade estimation. All block estimates were based on grade interpolation into parent cells with dimensions of 20m x 20m x 10m (XYZ) for each individual mineralized domain.
- Upon completion of the block model, swath plots were generated for the major mineralized domains to compare the gold and silver grades estimated in the blocks against composited raw grades on 40m cross-sections, and in 10m RL increments. The block model was further validated by conducting an ‘inverse-distance-squared’ estimate for comparison as a check on the potential for global systematic bias in the mineral resource estimate.
- The block model was classified according to geological and estimate confidence. Consideration was given to data density, geological and grade continuity, drill spacing, drill quality and core recovery, material type, suitability of estimation methodology and local estimation bias.
- The block model was assessed for the likelihood of the mineralization having reasonable prospects of eventual economic extraction. The assessment included factors such as commodity pricing, potential processing methods, potential mining methods, preliminary metallurgical test work results, and level of geological knowledge of the project. As a result of this assessment process, estimated blocks that did not meet the criteria remained as unclassified and are not included in mineral resource reporting. The final cut-off grade of 0.5 g/t gold equivalent was based on criteria including a $1,250/oz. gold price and a silver: gold ratio of 70:1, to produce a final mineral resource classification of Indicated and Inferred as defined by the Canadian Institute of Mining, Metallurgy and Petroleum (“CIM”) Definition Standards as required for NI 43-101 compliance.
- The final block model included the estimated mineralized domains with attributes for weathering, lithology, density, estimation domain code, material type, elements estimated, and mineral resource classification.
- Tonnage-grade curves were generated for a range of reporting cut-off grades for the main mineralized domains.